


Google Reports are among the simplest, yet the most often and effectively used analytics tools among discerning webmasters. One of the recent reports that have been added under Google Analytics is the Cohort Analysis Report.
This report is extremely useful for business owners as it helps to uncover the essential facts that help to understand the customer behavior and how to retain them to enhance profits. Though webmasters are bound to feel the inclination for jumping on to the analyses because of the awesome business knowledge to be gained, it makes sense to take things slow.
In today’s post, a first of two parts, I’ll be providing a basic understanding of the Cohort Analysis functionality in Google Analytics, and the core essentials of how the analyses mashes up data to churn our secrets. Plus, I’ll touch upon some practices to help you prepare your cohort analyses exercise diligently, and applying the same for measurable business benefits.
Once you pick up the nuances of a business result centric cohort analyses, we’ll execute the steps in the second part.
What is Cohort Analysis?
First things first; a cohort is just a group, segment or category of objects that have displayed common behavior, attributes or experiences within a specific timeframe.
So, a cohort analysis is the study focused on the activities of a specific cohort. For example, if you had to calculate the average income of employees of a particular company over the course of a four year period following their recruitment, you would effectively be conducting a cohort analysis.
Although many vouch for the smart features incorporated in Google Analytics, many webmasters and web analysts have also been rough on it because of the apparent lack of Cohort functionality, a feature which would have increased its appeal significantly.
unveiling the secrets Behind raw data
A unique feature of a cohort analysis is that the characteristics or attributes of users are time bound; it has been established that even a single user can display different characteristics over different timeframes.
For example, the same user might buy product X in the month of January but buy product Y in February. From an e-Commerce perspective, a certain user might login to your website on Monday through a laptop but visit again on Tuesday via a smartphone.
Timing is crucial, and cohort analyses captures this.
Now, Google Analytics defines user attributes in its detailed reports — both primary and secondary — in terms of “dimensions” including country, city, traffic source, keyword, product, and so on. So, all users who have visited your website from a certain country will belong to a common ‘country’ cohort and all the users who bought a product X belong to a ‘product X’ cohort.
The same user can be a member of multiple cohorts at the same time depending upon how you segment and interpret the data.
Another interesting fact is that a cohort analysis gets more interesting when cohorts are compared over a period of time.
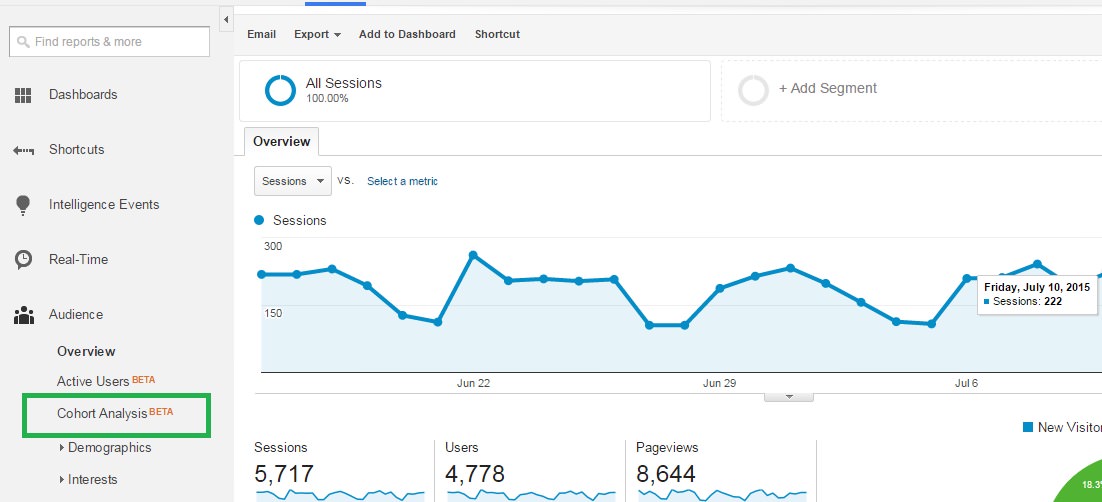
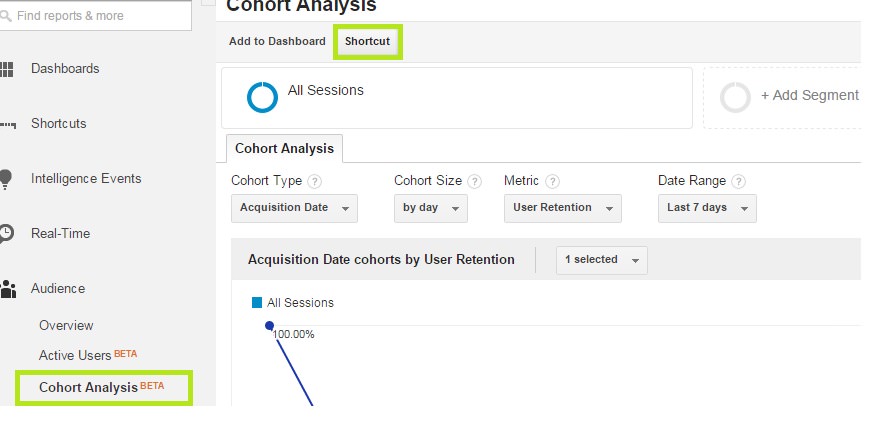
This report can be found under the Audience section as displayed in the screenshot below:
Using Cohort Analysis – The Basics
The business advantages that a detailed cohort analysis can bless you with are unchallengeable. Cohort analysis is a boon for e-Commerce websites.
Sites like Myntra, Snapdeal, Couponmachine etc leverage it to understand user behavior and subscription patters over time. Of course, that’s just one of the applications; there’s an ocean of knowledge hidden on the other side of a well done cohort analysis.
Step 1: The Prelim Question
First of all, like any analysis, your cohort analysis should begin with a question. It doesn’t matter if it’s the quintessential “why sales rise or fall”, the expectant “what’s the best time or season to launch a new ad”, or the perfectionism-seeking “how early should an ecommerce site send out emails before a holiday or event in order to get the highest amount of sales”?
Once you’ve decided on the question, you will also know what you will measure in your analysis.
Step 2: Zeroing in on common core characteristics
Identifying the common characteristic that defines the cohort you want to measure will be another critical step to help you get what you’re looking for.
In fact, if done correctly, a cohort analysis can go so far as to help you clarify and establish business trends so that you can stay ahead. These reports will help you reach some very obvious conclusions regarding your store or e-Commerce website.
One special feature you will really like about the Cohort report is its ability to segment data. You can apply multiple segments to your report and each segment will create a new table of data.
Cohort Analysis for Business
Cohort analysis is like gold-dust for any growing retail business because it will allow the business managers to understand observed online customer behavior. If you want to study your customers, you could start by grouping them in accordance to how they were referred to your business or website and then track the amount of money they have spent over time.
One of the most popularly conducted cohort analysis is one which groups customers based on their joining, enrollment or subscription date. This allows you to study spending trends of particular cohorts over different periods in time and even indicate whether the standard of your average customer is increasing or decreasing in over time.
What Cohort Analyses Can Do For You
In a cohort analysis, user retention is the single-most useful metric among all available options, especially since most cohort reports are used to observe behavioral consistencies over time.
However, there is a variety of metrics available, including goal achievement, sessions, session duration, and page views. Here’s a quick snapshot of the most irresistible benefits brought to the table by Cohort Analysis in Google Analytics:
(1) With Google Analytics, you can initiate comparisons among segmentation features in the same way as other Google Analytics reports. Google Analytics features a solution gallery that can be used or imported into an ongoing analysis, allowing users to make the most of solutions developed by fellow analysts.
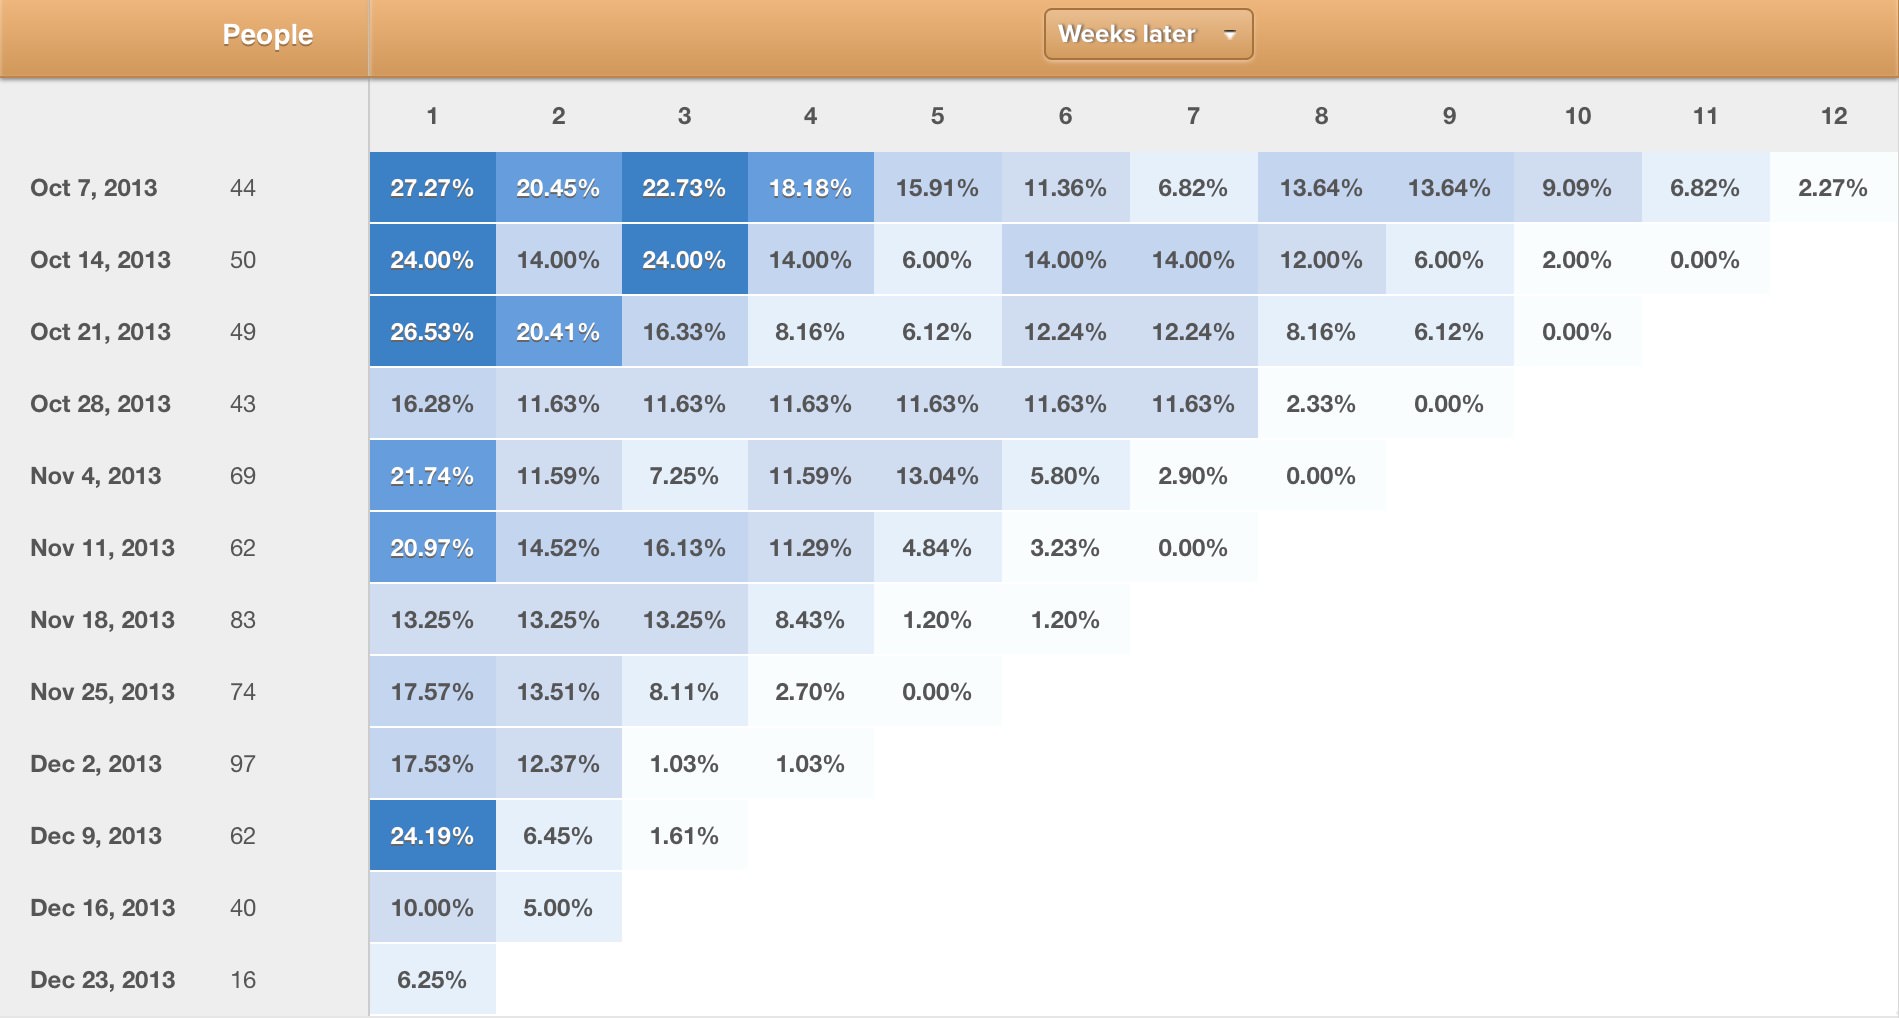
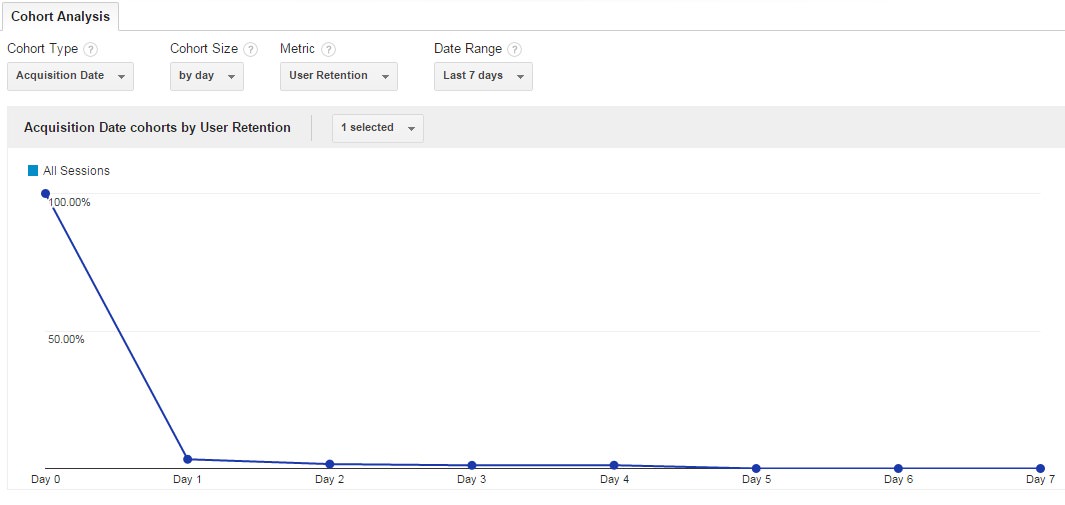
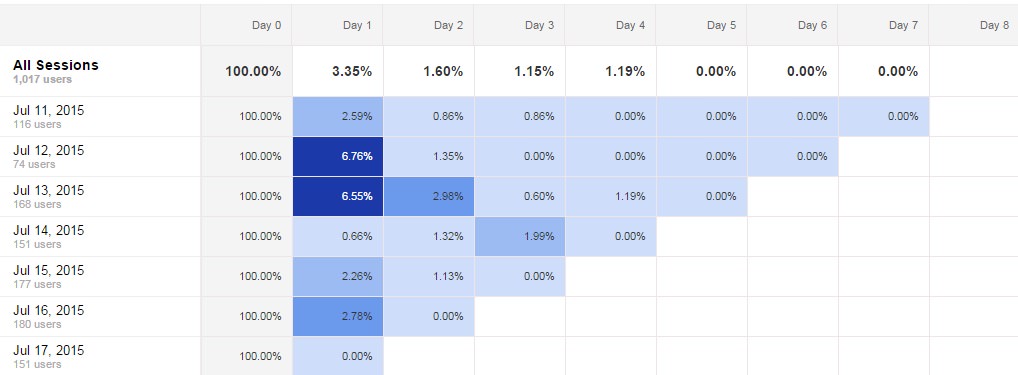
(2) Your report results will appear as a triangular table of metrics, which should effectively ascertain the degree of sustained consumer behavior that is taking place. And if that isn’t comprehensive enough for you, a timeline graph is also generated. But as an analyst, you would probably be more interested in the table. Once you’ve used it, you will gradually find clever uses of the cohort reports.
(3) Cohort reports will allow you to qualify data from a sustainability standpoint. For example, if there is a rise in volume or traffic, you can find out whether only a certain cohort is responsible and if the apparent increase is sustainable. Cohort analysis is a vital tool as it allows retail businesses to find out more about their customers and their behavior, particularly in longitudinal studies.
(4) An accurate Cohort Analysis will even help you identify differences in metrics like retention, acquisition, or engagement or interaction, to marketing trends, allowing you to ask consumers the right questions.
(5) Google Analytics even features Shortcuts that allow you to save your unique cohort reports, saving you hours of your time especially since you would know that configuring Cohorts report can be a long a tedious task (one that you would happily avoid!). Intuitive shortcuts can be accessed with a single click on the Google Analytics user interface.
Conclusion
Thus, it can be agreed upon that Cohort analysis is a very useful way to understand how different but specific user groups perform based on common attributes or characteristics.
That said, Google Analytics’ current cohort analysis tool is still pretty much in its infancy. Before the world wakes up to be able to use it as the decisive tool that it is meant to be, ensure that you blend your business acumen, web strategies, and analytical skills to create some actionable knowledge from the raw data being generated every second from your websites.
![]()
![]()


No Comments