


Many marketing gurus and job ads mention pivot tables as a ‘must have’ skill.
But guides on how to use them are usually too general. Here’s a specific example of how – and why – a digital marketer would use pivot tables.
As a digital marketer you are often faced with the task of making sense of log files. But log files are a blessing and a curse.
A blessing in the sense that they capture everything, but a curse in the sense that we are then expected to turn hard-to-read data into organized reports.
One type of log file which we often find ourselves converting is the campaign data from a social media platform.
Typically, these are a organized with each row being a single date – and all of the campaign data as columns.
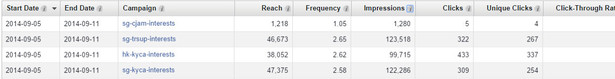
But that is often not the way you want to see things. It is much easier to read the report when the campaign is the left-most column and the dates are on the top. Then we can easily see how our data has changed daily for a particular campaign.
Of course this is possible with some fancy transposing with Excel, but thankfully there is another, simpler way to do it. And that is precisely what pivot tables are for.
What I’m using
To make this tutorial clear, I’ll stick to using the following:
- Log file: The file I’m working with is from the Facebook ad campaign report – which you can find at Ads Manager / Reports. Any daily ad report will work, though.
- Data: I’m only going to use dates, campaigns, ad impressions, and click-through rates (CTRs) – so those will be the only columns.
- Spreadsheet: I’m using Excel, but you could equally use the excellent – and free – LibreOffice.
Getting started
First off, export your data from Facebook and load it into a spreadsheet.
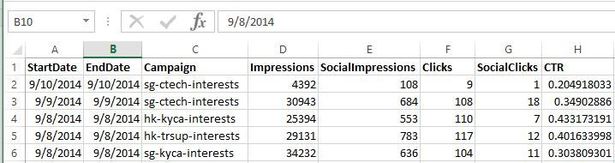
Now when you’re about to work with your data, it’s good to strip it down to just what you need. You can always go back to the source later and add more.
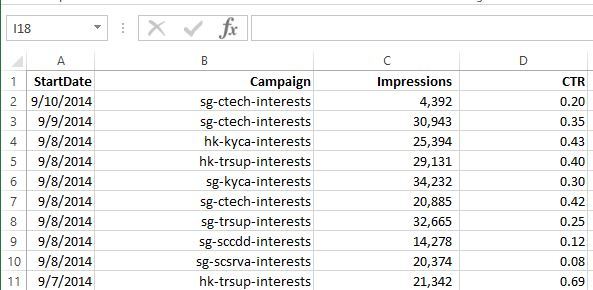
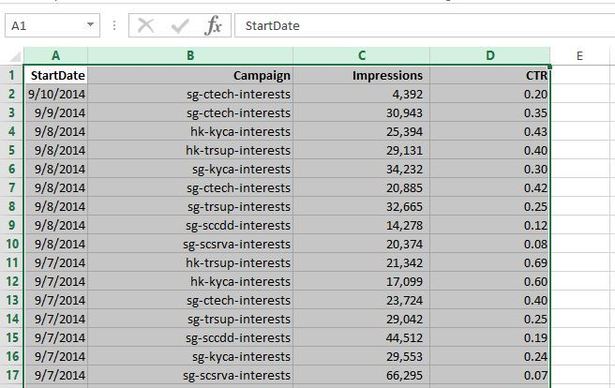
Okay, so your data should be in the format date, campaign, impressions, and CTRs – and it’s helpful to put headers on the columns.
What we’re going to do
We are going to:
- Change dates from being all in one column to being all the columns.
- Change campaign name from being all in one column to being one campaign per row.
- Move impression numbers to the corresponding date column and campaign row.
And here is what will happen to our data:
- The dates will become columns.
- The campaigns will become rows.
- The impressions will correspond to the date they are under and campaign row they are in.
That is the essence of the ‘pivot’ – and all you need to know for this tutorial.
How to do it
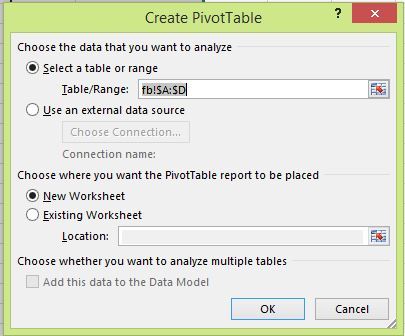
Select the whole table of data you are going to work with
And then select ‘Insert/Pivot Table’.
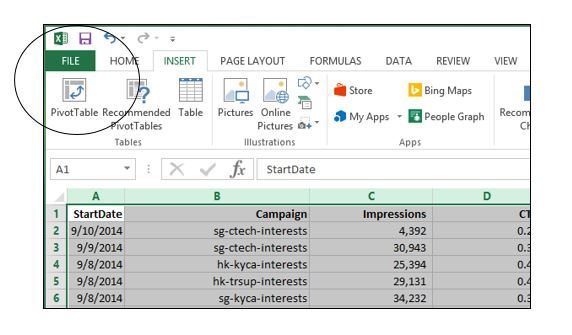
Choose a new worksheet as it will be clearer when we do the manipulation.
Now you should be presented with a somewhat confusing page which tells you to build a report. If you don’t see Excel as below, then make sure you’re on the right tab.
![]()
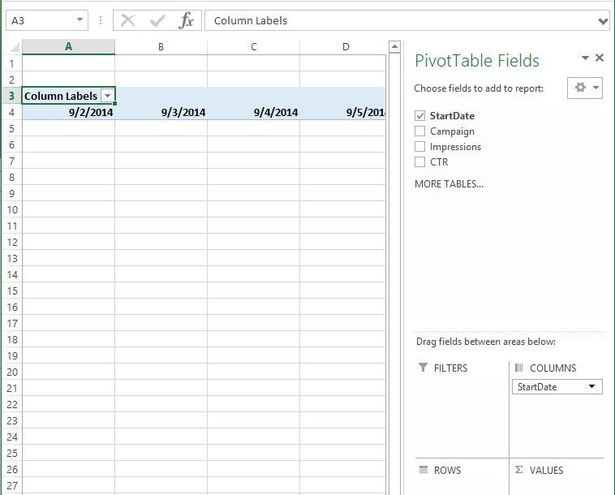
Luckily we already have the model that we need to follow – and it is almost as simple as just following the instructions:
1. Click on ‘Date’ (the word, not tickbox) and drag it into COLUMNS. You now have all the dates in your table as columns.
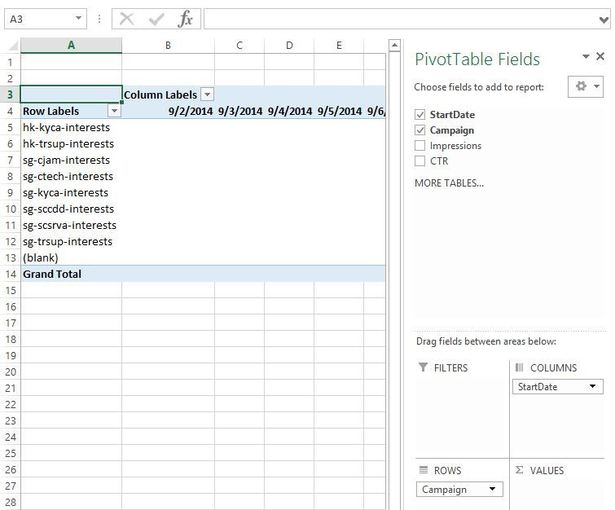
2. Click on ‘Campaign’ and drag it into ROWS. There we go – our campaigns are now the rows.
3. And finally drag ‘Impressions’ into VALUES.
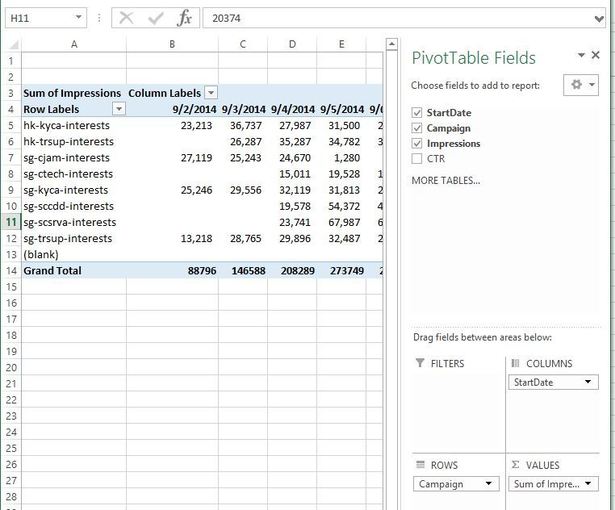
Voilà – you can now see your campaigns lined up on the left and see the impression values as columns. Much nicer than sorting by campaign and then by date, right?
Now for CTRs
I did say earlier that it’s ‘almost as simple’ as following the instructions. Well, if you have a look at your VALUES section you can see that it does not just say ‘Impressions’ but ‘Sum of Impressions’.
The reason for this is that there may be multiple values for the same date campaign combination – and the pivot table needs to know what to do.
For impressions, it’s easy. If there are days when, for whatever reason, the report tool spits out multiple impression numbers, you just add them. And that’s what Excel does by default (or sometimes it defaults to COUNT).
But for CTRs, adding – or counting – doesn’t make sense. If two campaigns with the same name ran on the same day, then you would want to know the average CTR over the sum of the two numbers.
Let’s try this out. Remove ‘Sum of Impressions’ from the VALUES section, and add CTR.
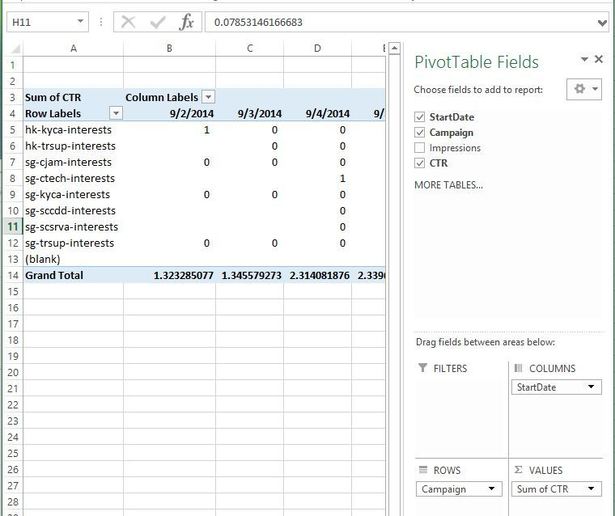
Yup, Excel got it wrong and added up your click-through rates – look at the total! Let’s change it to ‘Average’.
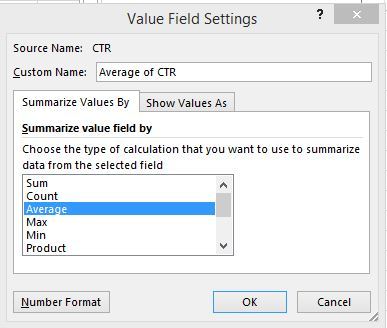
First, click on that little arrow on the right, and select ‘Value Field Settings’. You’ll get a new window and from there you can select ‘Average’…
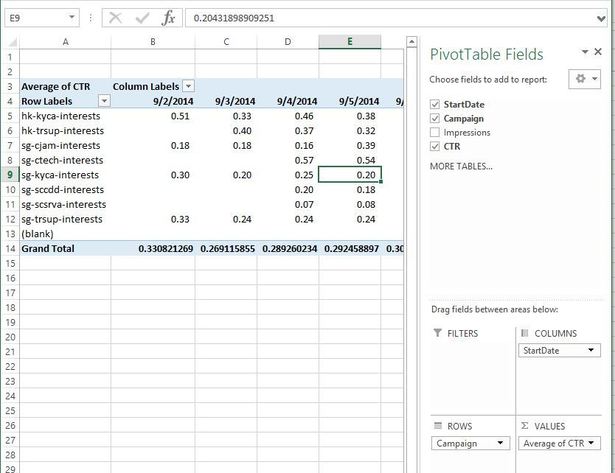
…and suddenly your numbers look a bit more accurate.
And so…
Pivot tables offer you a great way to change long and hard-to-read log files into a nice report suitable for managment consumption. Of course there are many other things you can do with the pivot table – including interactive graphs – but we’ll leave that for a future post.
In the meantime, please let me know if you have any other insights in the comments – any other typical uses, or tips and tricks.
And finally, pivot tables are an incredibly useful tool for performance marketing – so, like it or not, they are here to stay!
If you’re looking to improve your analytics skills, book yourself onto Econsultancy’s Web Measurement & Analytics Training Course.


No Comments